Traditionally, dashboards are used as reporting mechanisms that curate and clearly display data. But recently, dashboards have received an upgrade; they have been transformed into information management tools used to display information visually in a practical and helpful way. Now called BI dashboards, these tools can supercharge organizational data presentation and analysis when appropriately implemented.
Keep reading to find out what BI dashboards are and how they can improve the performance of your business.
What Is a BI Dashboard?
A typical dashboard will only display curated data. On the other hand, a BI dashboard acts like a tracking tool designed to build an interactive representation of data from a variety of sources. This means that users can oversee several key areas and also act on the data instantly.
By displaying historical trends, actionable insights, and real-time information, BI dashboards allow companies to streamline business processes, increase employee engagement, and reduce latency in your information ecosystem.

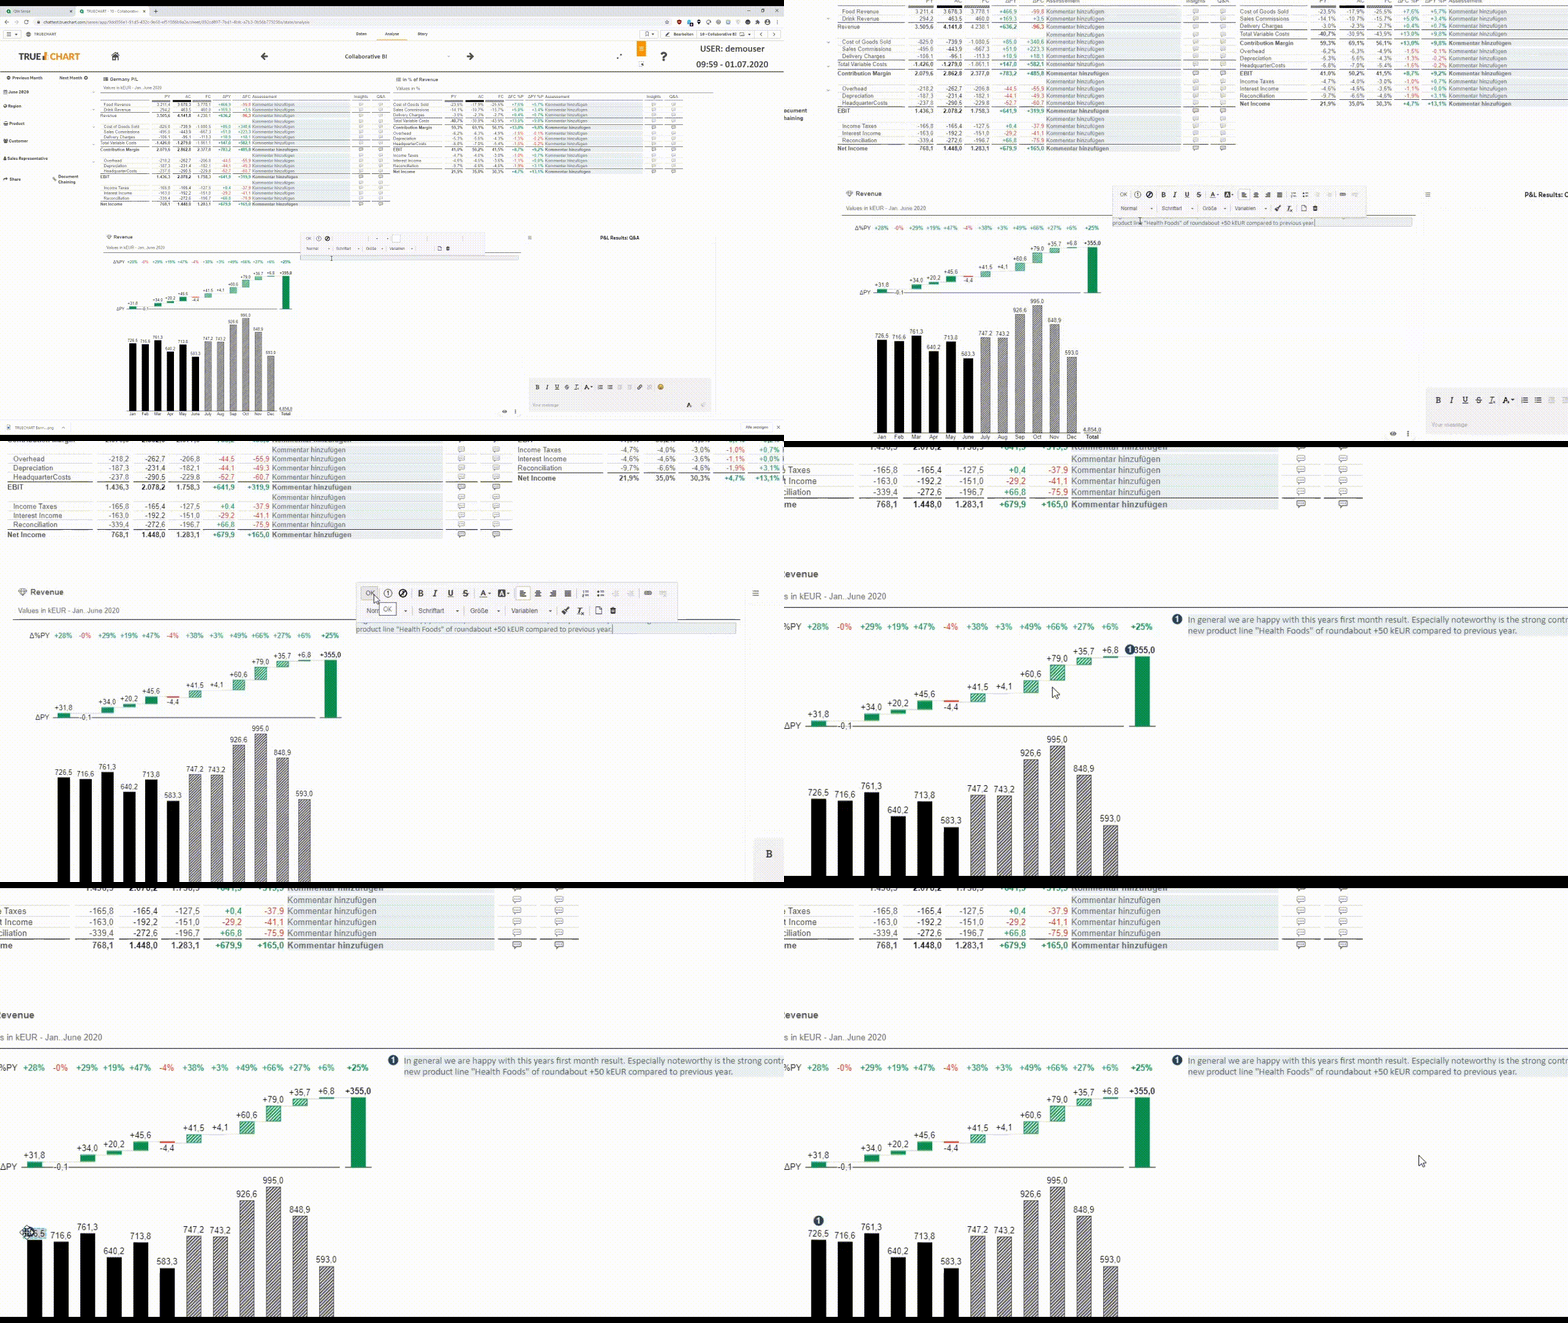
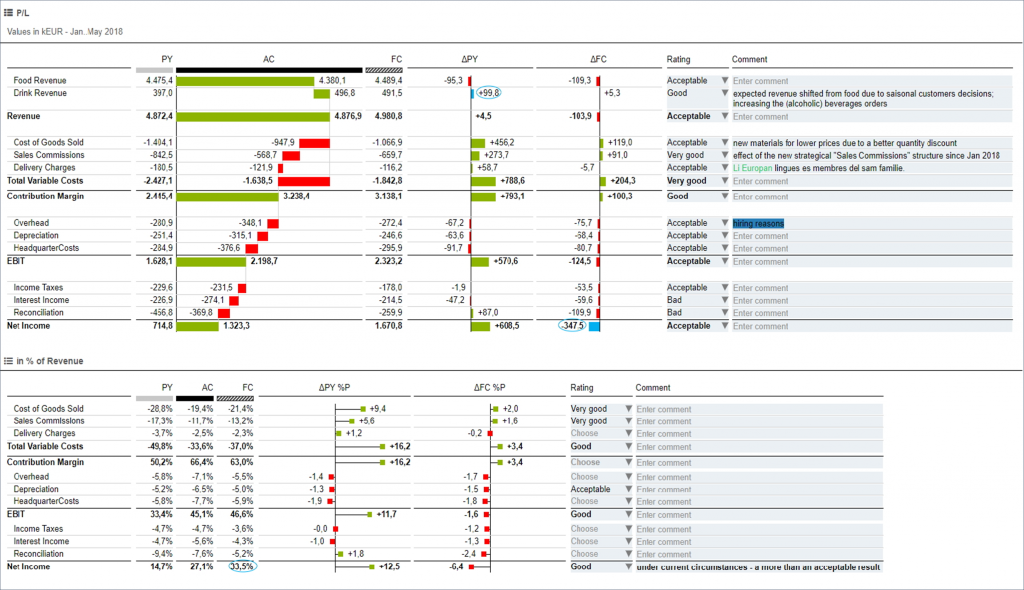
Example of an interactive BI dashboard (via TRUECHART)
Benefits of Using a BI Dashboard
Better Accessibility
The greatest advantage of BI dashboards is their ease of use and accessibility. Dashboards offer intuitive data visualization, and they are designed to be accessible and easy to navigate. In addition, it takes skill and experience to analyze raw data.
With BI dashboards, companies will be able to present information graphically and allow more employees to spot exceptions and opportunities – quickly and in a meaningful way.
From Insight to Action
BI dashboards are designed as a springboard that drives user insight into action. The accessible visual nature of BI dashboards allows users to identify issues and launch action quicker than before. It’s like “running the numbers” without actually running the numbers, because you dashboard will provide all the necessary insights for you – if not instantly, then it’s only a matter of clicks.
Consequently, BI dashboards ensure faster decision-making and empower users to analyze important metrics with ease. This is definition of being “data-driven”.
Flexible and Customizable
BI Dashboards are customizable and made to grow and change with the company. As a business evolves, so do its KPIs change. Traditional dashboards lack the flexibility to display what is relevant in real time and need to be manually updated. On the other hand, a BI dashboard is easy to customize and made to present every single strand of relevant data.
When speaking of customization a.k.a. visualization, it is vital that the right visual and communication standard is used. One of the most used standards today is IBCS or the International Business Communication Standards. They use very few colors, linear elements, and a simplified overview of all information to provide simple, action-driven reports.

Real-Time and Mobile Friendly
As mentioned in the section before, BI dashboards are made to present a snapshot of real-time performance of the company. Managing a business effectively and efficiently is more intuitive with BI dashboards and has benefits in improved operational intelligence, increased efficiency, and higher user engagement levels.
In addition, BI dashboards shoul also be made compatible with a wide range of devices to provide frictionless access to real-time data. Dashboards optimized for mobile devices allow managers to stay on top of time-sensitive information, which speeds up and improves decision-making capabilities.
BI dashboards are one of the most recognizable elements of your business’ digital strategy. As such, they must be configured to display meaningful KPIs and allow decision-makers to ‘interact’ with the data. With TRUECHART as your partner, your company will be able to analyze, visualize, and extract information and deep, meaningful insights right from your dashboard.
Stay up-to-date with TRUECHART. Follow us on LinkedIn.
